|
To make graphic report on the tasks use following steps:
- Set filter to display required tasks
- Group the tasks by required fields
- Go to “Charts” panel
- Select required fields for the diagrams from the corresponding drop-down lists on Charts toolbar
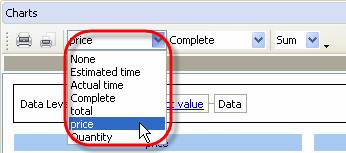
-
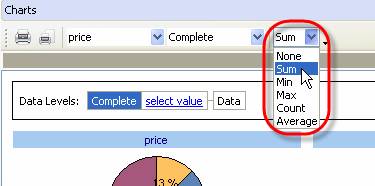
If the tasks are grouped by any field you can display the sum, minimum, maximum, quantity and average value for task field on the diagrams. Select required operation from corresponding drop-down list on Charts toolbar.
- Select required type of diagram from the drop-down list in the right upper part of Chart panel
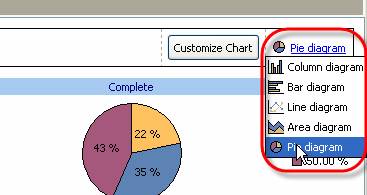
-
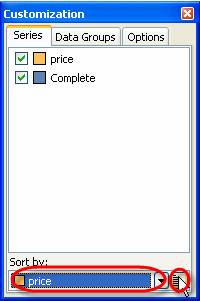
Click on “Customize Chart” button, check those diagrams that you want to display and uncheck the rest ones. From “Sort by” drop-down list select the field you want the diagram to be sorted by and click on the button nearby to select the type of sorting – ascending or descending.
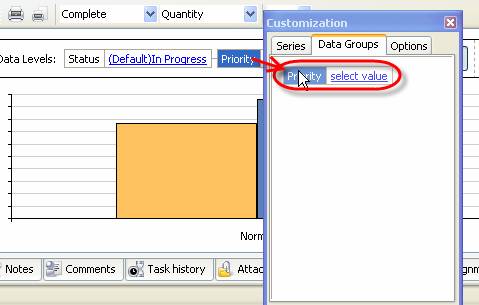
Select “Data Groups” tab, drag data level that you want to hide and drop it to the empty space on “Data Groups” tab. To display data level that was hidden earlier, drag it on “Data Groups” tab and drop it where you need on “Data Levels” box.
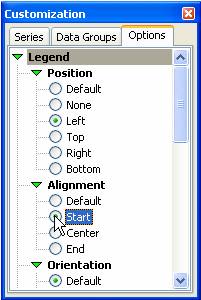
Select “Options” tab and set required appearance for diagram legend, title and customization zone. If you want value hints to be shown while directing the cursor to the diagram, check corresponding option on “Options” tab, or uncheck it otherwise.
-
“Data Levels” option demonstrates the order of the diagramed fields. To change their order drag required field’s title and drop it where you need on “Data Levels” box.
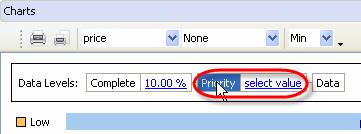

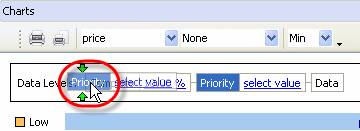
For example, the tasks in your list are grouped by “Priority” and “Complete” fields. In “Data Levels” box you will see the same sequence of fields. You want to make a diagram per “Price” field.
By selecting “Priority” field in “Data Levels” box you will diagram “price-priority” relation (the value of “Price” field for each value of “Priority” field).
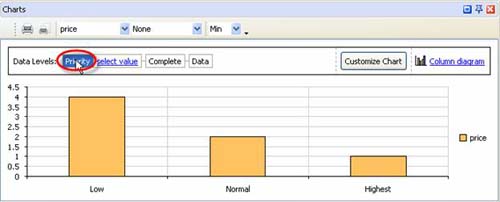
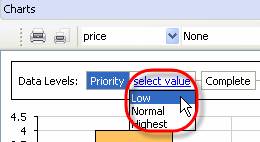
Left click on “Select value” drop-down list to select one of the values of “Priority” field that the tasks of selected task group have or click on the corresponding diagram for this value. For example, you select “Low” priority and in that way you diagram the values of “price” field for each value of “Complete” field of the tasks with “Low” priority.
OR


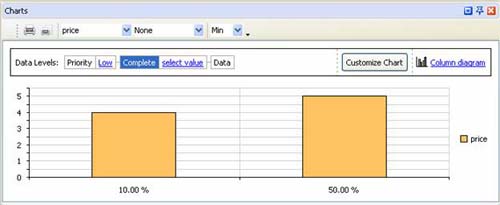
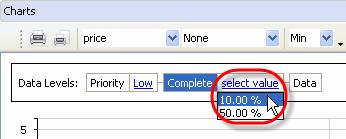
By selecting definite value of “Complete” field from corresponding drop-down list or clicking on the diagram for this value, e.g. 10.00 %, you will diagram the price value of the tasks that have selected “Complete” value (10.00 %).
OR


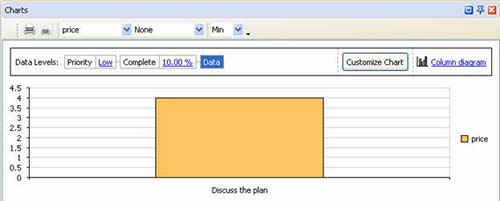
You can return to required data level by selecting corresponding field on “Data Levels” box or right clicking on the diagram in series.
-
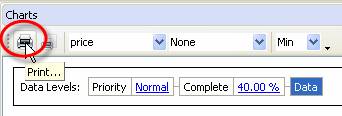
Print out required diagram or preview it and create your own print design by clicking on “Print…” or “Preview…” button on Charts toolbar correspondingly.
|
